
Журнал «Боль. Суставы. Позвоночник» 3 (15) 2014
Вернуться к номеру
Evaluating spine micro-architectural texture (via TBS) discriminates major osteoporotic fractures from controls both as well as and independent of site matched BMD: the Eastern European TBS study
Авторы: Vasic J. - Department of Physical Medicine and Rehabilitation, Railway Healthcare Center, Belgrade, Serbia; Petranova T. - Clinic of Rheumatology, Medical University, Sofia, Bulgaria; Povoroznyuk V. - Department of Clinical Physiology and Pathology of Locomotor Apparatus, D.F. Chebotarev; Institute of Gerontology NAMS Ukraine and Ukrainian Scientific-Medical Center for the Problems of Osteoporosis, Kiev, Ukraine; Barbu C.G. - Department of Endocrinology, Carol Davila University of Medicine and Pharmacy, Bucharest, Romania; Karadzic M. - Institute for Treatment and Rehabilitation «Niska Banja», Nis, Serbia; Gojkovic F. - Department of Physical Medicine and Rehabilitation, Railway Healthcare Center, Belgrade, Serbia; Elez J. - Department of Internal Medicine, Railway Healthcare Center, Belgrade, Serbia; Winzenrieth R. - R&D Department, Med-Imaps, PTIB, Hopital Xavier Arnozan, Pessac, France; Hans D. - Bone Diseases Center, DAL, Lausanne University Hospital, Lausanne, Switzerland; CulaficVojinovic V. - Department of Internal Medicine, Railway Healthcare Center, Belgrade, Serbia; Poiana C. - Department of Endocrinology, Carol Davila University of Medicine and Pharmacy, Bucharest, Romania; Dzerovych N. - Department of Clinical Physiology and Pathology of Locomotor Apparatus, D.F. Chebotarev;Institute of Gerontology NAMS Ukraine and Ukrainian Scientific-Medical Center for the Problems of Osteoporosis, Kiev, Ukraine; Rashkov R. - Clinic of Rheumatology, Medical University, Sofia, Bulgaria; Dimic A. - Institute for Treatment and Rehabilitation «Niska Banja», Nis, Serbia
Рубрики: Ревматология, Травматология и ортопедия
Разделы: Новости
Версия для печати
The aim of the study was to assess the clinical performance of the model combining areal bone mineral density (aBMD) at spine and microarchitecural texture (TBS) for the detection of the osteoporotic fracture. The Eastern European Study is a multicenter study (Serbia, Bulgaria, Romania and Ukraine) evaluating the role of TBS in routine clinical practice as a complement to aBMD. All scans were acquired on Hologic Discovery and GE Prodigy densitometers in a routine clinical manner. The additional clinical values of aBMD and TBS were analyzed using a two steps classification tree approach (aBMD followed by TBS tertiles) for all type of osteoporotic fracture (All-OP Fx). Sensitivity, specificity and accuracy of fracture detection as well as the Net Reclassification Index (NRI) were calculated. This study involves 1031 women subjects aged 45 and older recruited in east European countries. Clinical centers were cross-calibrated in terms of BMD and TBS. As expected, areal BMD (aBMD) at spine and TBS were only moderately correlated (r2 = 0.19). Prevalence rate for All-OP Fx was 26%. Subjects with fracture have significant lower TBS and aBMD than subjects without fracture (p < 0.01). TBS remains associated with the fracture even after adjustment for age and aBMD with an OR of 1.27 [1.07–1.51]. When using aBMD T-score of –2.5 and the lowest TBS tertile thresholds, both BMD and TBS were similar in terms of sensitivity (35 vs. 39%), specificity (78 vs. 80%) and accuracy (64 vs. 66%). aBMD and TBS combination, induced a significant improvement in sensitivity (+28%) and accuracy (+17%) compared to aBMD alone whereas a moderate improvement was observed in terms of specificity (+9%). The overall combination gain was 36% as expressed using the NRI. aBMD and TBS combination decrease significantly the number of subjects needed to diagnose from 7 for aBMD alone to 2. In a multicentre Eastern European cohort, we have shown that the use of TBS in addition to the aBMD permit to reclassified correctly more than one-third of the overall subjects. Furthermore, the number of subjects needed to diagnose fell to 2 subjects. Economical studies have to be performed to evaluate the gain induced by the use of TBS for the healthcare system.
Osteoporotic fracture, Bone mineral density, Trabecular bone score (TBS), Bone microarchitecture.
Статья опубликована на с. 9-19
Introduction
Osteoporosis is a common bone disease leading to increased bone fragility and escalated fracture risk. Osteoporosis is characterized by low bone mass, but also by alterations in bone microarchitecture. In routine daily clinical practice, the gold standard for osteoporosis assessment is the evaluation of areal Bone Mineral Density (aBMD), via dual-energy X-ray absorptiometry (DXA). Traditionally, aBMD has been considered the major determinant of bone strength and fracture risk [1]. However, it has been shown that: (1) aBMD is insufficient at determining bone strength [2, 3]; (2) aBMD is insufficient at predicting fractures [4, 5]; and (3) aBMD is inadequate at assessing response to drug therapy [6]. Other parameters play a key role in bone strength, such as bone microstructure [7, 8]. Until recently, assessing bone microstructure was not feasible in routine clinical practice.
Trabecular bone score (TBS) is a grey-level texture parameter which can be applied to DXA images. TBS quantifies spatial variations of local grey level values into the 2D projected image [9, 10]. TBS is derived from the experimental variogram [9, 10]. It correlates with standard 3D bone microarchitecture parameters such as connectivity density, trabecular number, and negatively with trabecular separation [9, 10]. Recently [12], it has been shown that TBS is also related to bone strength. More precisely, in this study, authors have shown that TBS was correlated with SMI (r = –0.62, p = 0.01) as well as bone stiffness (r = 0.64, p = 0.007), independently of the bone mass. TBS is an indirect evaluation of the trabecular bone structure but also to the bone strength. Previous studies have demonstrated the added clinical value of TBS [13–20]. It has been shown that: (1) TBS is able to discriminate subjects with fractures from subjects without fractures, matched for age, BMD or both, even after adjusting for BMI [13–17]; and (2) TBS can predict major osteoporotic fractures as well as BMD, an independent of it [18–20]. Nevertheless, daily clinical implications regarding the use of TBS are not clearly defined.
We conducted the current study to validate the ability of TBS to detect all osteoporotic fracture types in an Eastern European cohort. In this study, we focused on the clinical added values of TBS in combination with the BMD in term of sensitivity, specificity, accuracy but also considering the reclassification induced by the use of TBS and on the number of subject needed to diagnose.
Materials and methods
Study subjects
We conducted a retrospective, non-random, multi-centre case-control study. Recruitment of female subjects was performed using the medical record database at six centres: The Railway Healthcare Institute of Belgrade (Serbia), the Rheumatology Clinic at the Medical University of Sofia (Bulgaria), the Institute for Treatment and Rehabilitation in Niska Banja (Serbia), the Department of Clinical Physiology and Pathology of Locomotor Apparatus, in Kiev (Ukraine) and the «C.I. Parhon» and Elias Hospital clinical facilities, Department of Endocrinology, Carol Davila University of Medicine and Pharmacy in Bucharest (Romania). During the observation period, between the six centres, 1762 women ages 30 and older were recruited.
To be included in the study, subjects had to be Caucasian, aged between 45 and 85 years, and have a body mass index (BMI) between 17 and 35 kg/cm2. To be fully eligible as a case, the woman had to present with at least one low-energy fracture. All types of osteoporotic fracture were considered for this study (All OP). Conversely, controls could not have any evidence of any low-energy fracture at any bone site. Individuals were excluded if they (1) had undergone any spinal surgery; (2) had any evidence of inflammatory changes or arthrosis in the lumbar spine; or (3) had three or more non-observable lumbar vertebra; (4) have treatments affecting bone metabolism.
Areal bone density at lumbar spine levels L1–L4 (aBMD) was evaluated with Hologic Discovery and GE Prodigy densitometers as per routine clinical practice. TBS was evaluated in the same regions of measurement as those used for aBMD, using the program TBS iNsight® (V1.9.2, Med-Imaps, France). aBMD and TBS were calculated as the mean values of the individual measurements for vertebrae L1–L4 after excluding any fractured and/or vertebrae with the presence of severe arthrosis. TBS then was assessed by the University of Lausanne (Switzerland) based on the anonymized DXA scan, blinded to all clinical parameters and outcomes.
Centres were cross-calibrated for TBS using a custom-made phantom (Med-Imaps, France) which exhibits five different TBS values. This calibration phantom is also composed of a soft tissue kit which mimics a mean thickness of 17 cm and fat content of 25%. After TBS calibration, differences between Prodigy and Hologic devices represents an absolute value of 0.028. A standardization on aBMD values (saBMD) has been done using conversions equations for GE-Lunar Prodigy and Hologic Apex systems proposed by Fan et al. [21]. All BMD values have been standardized to GE-Lunar Prodigy systems using the following equation:
saBMD at L1–L4
GE-Lunar Prodigy = 1.140 x Hologic + 0.037.
After standardization, difference in term of saBMD between Prodigy and Hologic devices represents an absolute value of 0.026 g/cm2.
This study was conducted in accordance with the current version of the Declaration of Helsinki and under the laws and regulations enforced by the Department of Health. Each subject enrolled into the study was ensured anonymity.
Statistical analysis
All statistical analyses were performed using MedCalc software (v12.3.0, http://www.medcalc.be). Inter-group differences were identified by means of the parametric Student’s T test or the non-parametric Wilcoxon’s signed-ranks test, depending on the normality of parameter distribution. Pearson’s correlation analysis was used to assess correlations between the various studied parameters. Univariate and multivariate logistic regression models (with backward variable entry) were used to investigate possible correlations between independent variables (age, weight, height, BMI, aBMD and TBS) and fracture status. The detection value for each parameter was further evaluated both by odds ratios (OR) — expressed for each decrease of one standard deviation — and by determining the receiving operator curve (ROC) and area under the ROC (AUC); for both these estimates, OR and AUC, 95% confidence intervals were calculated. Differences between AUC were detected by means of pair-wise comparisons. Any p value < 0.05 was considered statistically significant. The additional clinical values of aBMD and TBS were analyzed via a classification tree approach. This classification tree was formulated within a two-step process, starting with aBMD T-score classification followed by TBS tertile classification. The added clinical value of the tree classification approach was evaluated considering an aBMD T-score of –2.5 and first TBS tertile (lowest TBS values) thresholds, in terms of the sensitivity, specificity and accuracy of fracture detection. The added clinical value performance of the combined model was compared against the clinical performance of using an aBMD T-score of –2.5 and the lowest TBS tertile, each alone. Classification improvement of the combined model was assessed by calculating the Net Reclassification Index (NRI) [22]. Finally, the number of subjects needed to diagnose was evaluated as the inverse value of the Youden’s index [23].
Results
Description of the study group
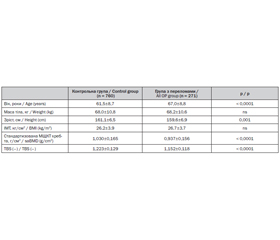
Out of the 1762 potentially-eligible Caucasian women recruited, 271 women were deemed eligible as cases, exhibiting at least one osteoporosis-related fracture; meanwhile, 760 women without fractures were deemed eligible as controls. Sites of osteoporotic fracture were the hip (7.7%), spine (41.3%), humerus (13.3%) and forearm (42.1%). Subjects with and without fractures were no different in mean weight (p > 0.3) and BMI (p > 0.1); but women with fractures were older (p < 0.001) and shorter (p < 0.001) as presented Table 1. In addition, both saBMD and TBS were significantly lower in subjects with a fracture (p < 0.001).
/12/12.jpg)
Significant weak to moderate correlations were observed between TBS and subject height (r = 0.08, p < 0.005), age (r = –0.34, p < 0.001) and saBMD (r = 0.47, p < 0.001), whereas no correlations were evident between TBS and weight (r = 0.05, p = 0.13) or BMI (r = –0.09, p < 0.005).
Association between sBMD, TBS, anthropometric data and the presenceof the fracture
Age, height, saBMD and TBS were associated with the presence of an osteoporotic fracture (Table 2). After adjusting for age, saBMD and TBS remained significant (p < 0.001), with an OR per SD of 1.74 [1.48–2.04] and 1.52 [1.29–1.78], respectively.
/13/13.jpg)
Combined saBMD and TBS model (Model 1, see Table 2) improved fracture detection by 35–43% compared to saBMD or TBS alone as demonstrated by ORs (1.93 [1.67–2.23] vs. 1.50 [1.27–1.77] and 1.58 [1.32–1.78] respectively). The AUC of Model 1 was signi–ficantly higher than the AUC for saBMD (p < 0.01), whereas no significant difference was apparent for TBS (p > 0.05).
Using multivariate analysis, age, saBMD and TBS cofactors remained significant (p < 0.01) for osteoporotic fracture detection (Model 2). The combined Model 2 significantly improved osteoporotic fracture detection (OR = 2.20 [1.89–2.55]) relative to each parameter used alone or relative to the Model 1, as shown by significant differences (p < 0.001) between their AUCs (Table 2; Fig. 1).
Clinical added value of TBS combined with saBMD: sensitivity, specificity, accuracy,NRI and NDD
In terms of clinical usability (two-step classification tree), the TBS tertile thresholds obtained in this study were 1.155 and 1.252 for the lowest and highest tertiles, respectively. An saBMD T-score of –2.5 and first (lowest) TBS tertile thresholds were similar in terms of sensitivity (35 vs. 39 %), specificity (78 vs. 80 %) and accuracy (64 vs. 66 %), as presented in Fig. 2. When combined (Fig. 2), a major improvements in sensitivity (+28 and +24 %, respectively) and accuracy (+17 and + 15 %, respectively) were evident with somewhat less marked improvement noted for specificity (+9 and +7 %) relative to isolated performance of the –2.5 aBMD T-score threshold and first TBS tertile threshold, respectively.
NRI of the combined model were +38 and +31 % compared with saBMD and TBS alone respectively. NRI results indicate that, using the combined model, 38% of the overall subjects were reclassified correctly in addition to those already classified using the –2.5 T-score threshold. Among those subjects, additional subjects with fracture were detected and represent 21% of the overall subjects with fracture (57/271). Finally, the combined model decrease significantly the number of subjects needed to diagnose to reach 2 patients in comparison to 7.4 and 5.3 for saBMD and TBS, respectively.
Discussion
In this study, we investigated the capacity of the TBS to detect osteoporotic fractures within the context of a multicentre Eastern European cohort. As expected, TBS detected osteoporotic fractures as well as areal Bone Mineral Density of the lumbar spine, even after adjusting for age and/or TBS and saBMD (OR TBS = 1.27 [1.07–1.51] vs. OR saBMD = 1.59 [1.33–1.89]). The correlation between saBMD and TBS was moderate (r = 0.44), explaining 19.4% of its variance. This correlation level is similar (r = 0.44 vs. 0.2 < r < 0.6) to levels observed in studies performed using the Hologic and GE device series. Even though the correlation between saBMD and TBS was moderate in strength, TBS exhibited a significant added value over saBMD and/or age, in terms of fracture detection. Furthermore, the combination of age, saBMD and TBS significantly improved osteoporotic fracture detection, as demonstrated by significant differences between the AUC of the combined model and those for each of the three parameters used alone (p < 0.01).
/14/14.jpg)
Previously published cross-sectional studies [13–17] have shown that TBS is significantly lower in those with a fracture, even after adjusting for age and/or BMD and/or BMI [13–17]. In particular, in [15], the investigators evaluated TBS detection capability within the OsteoLaus cohort, a population-based survey involving 631 women between 50 and 80 years old. In this study, the age-and BMI-adjusted ORs for all osteoporotic fracture detection were 1.3 [1.1–1.6] and 1.4 [1.1–1.7] for spine BMD and spine TBS, respectively. More recently, Leib et al. [17] evaluated TBS discrimination-ability in a large US population of non-Hispanic Caucasian women. This study, which dealt with all types of osteoporotic fracture, involved 305 subjects (mean age 59.7 ± 8.3 years) with fractures and 1877 (mean age 57.4±7.3 years) controls. The ORs were 1.24 [1.10–1.41] and 1.36 [1.21–1.53] for TBS and BMD, respectively. After adjusting for spine BMD and several clinical risk factors, the value of TBS remained significant, with an OR of 1.18 [1.02–1.35]. Finally, two prospective studies have shown that TBS predicts osteoporotic fractures as well as BMD, and independently from it, with an OR of 1.17 [1.09–1.25] after adjusting for spine BMD and major clinical risk factors [18], and an OR of 1.34 [1.04–1.73] after adjusting for age and prevalent fracture [19]. Results obtained in our study corroborate those previously obtained results. Similar and homogeneous ORs per standard deviation decrease were obtained for TBS in our study after adjusting for age and spine BMD and/or other clinical risk factors [13–20]. This consistency in OR suggests that TBS discrimination performance is partially independent of the study protocol, other common parameters taken into account for osteoporosis diagnosis, and the type of DXA device used.
Combining TBS and saBMD in a model (Model 1) improved fracture detection, since the OR of Model 1 was 1.93 [1.67–2.23]. When an additional age adjustment was performed (Model 2), the OR for Model 2, which incorporated age (p < 0.0001), aBMD (p < 0.001) and TBS (p < 0.01), ultimately reached 2.20 [1.89–2.55]. In both Model 1 and 2, the improvement in fracture detection was significant, when compared against saBMD alone, as demonstrated by significant differences between their AUCs (p < 0.001). The observed added detection value of TBS over spine BMD was in agreement with results obtained in [18]. In this earlier prospective study, which involved 29407 Canadian women, fracture prediction improved when spine BMD and TBS were combined, relative to fracture prediction with BMD or TBS used alone (p < 0.0001). Furthermore, for Model 2, the significant improvement was also apparent versus the AUC of TBS and age used alone (p < 0.001 and p < 0.001, respectively).
From a clinical point of view, combining saBMD and TBS makes sense, since aBMD evaluates bone quantity whereas TBS assesses bone microarchitectural texture status [9–11], both of which contribute to bone strength [3, 4, 7, 12]. Previous studies have yielded two major conclusions about TBS: (1) any correlation between spine BMD and TBS is weak to moderate (from 0.1 to 0.6, depending on the study [13–20]); and (2) TBS performs as well as spine BMD at detecting osteoporotic fractures [1420]. Consequently, we can argue that using TBS permits us to detect different individuals at risk for fracture than BMD. To illustrate this last statement, we used a two-step classification tree (WHO stratification coupled with TBS tertile stratification) and evaluated this combination, in terms of fracture detection. In this study, sensitivity, specificity and accuracy of aBMD (with a –2.5 T-score threshold) and TBS (with a first/lowest tertile threshold) were comparable (38 vs. 43 %, 76 vs. 78 %, and 62 vs. 66 % for sensitivity, specificity and accuracy, respectively).
However, when the –2.5 aBMD T-score and first TBS tertile were used together, sensitivity largely improved by 28 % relative to the –2.5 aBMD T-score threshold to reach 65 %. Accuracy and specificity also improved, by 18 and 10 %, respectively. These results corroborate earlier findings [20]. In a previously-published, population-based Swiss study, sensitivities of 33.3 and 42.9 % and specificities of 74.1 and 74.6% were observed for aBMD and TBS, respectively. When aBMD and TBS were combined, sensitivity rose to 59.5 %, which is roughly the sensitivity we observed in the current study (65 %). As for ORs, consistency in fracture detection was noted, in terms of both sensitivity and specificity, in these two studies, indicating the stability of TBS detection rates from one study to the next. Combination of TBS and aBMD induces and NRI of 38 % in comparison with aBMD alone.
In addition, in this study we have evaluated the overall reclassification induced by the use of TBS in complement to the saBMD. 36% of the overall subjects were correctly reclassified as evaluated using the NRI. Among these subjects, a major part were subjects with fracture. We have also evaluated this gain in terms of number of subjects needed to diagnose (NND). The use of TBS decrease the NDD to 2. This is an important result since it has several implications in term of patient screening as well as for the health care cost. This first results has be confirmed in other cohort and cost-effectiveness of the use of TBS have to be evaluated.
The current study is not without limitations. The most relevant is that it was a retrospective case-control study. Hence, we cannot directly imply any causative association between low TBS values and osteoporotic fractures. However, in [18–20], TBS was demonstrated to predict osteoporotic fractures both as well as, and independent of BMD, validating the causative link between TBS and osteoporotic fracture incidence. The second major limitation directly concerns subject recruitment, as treatments and other diseases potentially impacting bone metabolism were not taken into account. Consequently, confounding effects upon TBS were not considered. Nevertheless, it has been shown that, although secondary causes of osteoporosis like hyperparathyroidism and rheumatoid arthritis negatively affect TBS (TBS values in these subjects are lower than in controls), subjects with fractures still exhibit lower TBS than subjects without fractures [24, 25]. Similar results have been obtained in glucocorticoid-treated subjects [26, 27].
In conclusion, the current study confirms previous data published on TBS concerning its discriminatory power for osteoporosis fracture detection. In a multi-centre Eastern European cohort, we again have shown that combining TBS and BMD dramatically increases the sensitivity and overall accuracy of osteoporotic fracture detection, even after adjusting for age. The clinical added value of TBS permitted to decrease the number of subject needed to diagnose to 2 in this study. This result is very promising for both patient management and in term of cost for the health care system if confirmed.
Conflict of interest. R. Winzenrieth is a senior scientist at Med-Imaps, Didier Hans is co-owner of the TBS patent and has corresponding ownership share in Medimaps group. All the others did not have any conflicts of interest.
1. WHO Study Group. Assessment of fracture risk and its application to screening for postmenopausal osteoporosis [Report of the WHO Study Group] // World Health Organ Tech. Rep. Ser. 1994: 843-1129.
2. Johnell O., Kanis J.A., Oden E., Johansson H., De Laet C., Delmas P., Eisman J.A., Fujiwara S., Kroger H., Mellstrom D., Meunier P.J., Melton L.J. 3, O’Neill T., Pols H., Reeve J., Silman A., Tenenhouse A. Predictive value of BMD for hip and other fractures // J. Bone Miner. Res 2005; 20: 1185-1194.
3. Rice J.C., Cowin S.C., Bowman J.A. On the dependence of the elasticity and strength of cancellous bone on apparent density // J. Biomech. 1988; 21: 155-168.
4. Hordon L.D., Raisi M., Paxton S., Beneton M.M., Kanis J.A., Aaron J.E. Trabecular architecture in women and men of similar bone mass with and without vertebral fracture: part I. 2-D histology // Bone. 2000; 27: 271-276.
5. McClung M.R. Do current management strategies and guidelines adequately address fracture risk? // Bone. 2006; 38: S13-S17.
6. Compston J. Monitoring osteoporosis treatment // Best Pract. Res Clin. Rheumatol. 2009; 23:781-788.
7. Seeman E., Delmas P.D. Bone quality — the material and structural basis of bone strength and fragility // N. Engl. J. Med. 2006; 354: 2250-2261.
8. Ito M., Ikeda K., Nishiguchi M., Shindo H., Uetani M., Hosoi T., Orimo H. Multi-detector row CT imaging of vertebral microstructure for evaluation of fracture risk // J. Bone Miner. Res 2005; 20: 1828-1836.
9. Hans D., Barthe N., Boutroy S., Pothuaud L., Winzenrieth R., Krieg M.A. Correlations between trabecular bone score, measured using anteroposterior dual-energy X-ray absorptiometry acquisition, and 3-dimensional parameters of bone microarchitecture: an experimental study on human cadaver vertebrae // J. Clin. Densitom. 2011; 14: 302-312.
10. Winzenrieth R., Michelet F., Hans D. 3D microarchitecture correlations with 2D projection image grey level variations assessed by TBS using high Resolution CT acquisitions: effects of resolution and noise // J. Clin. Densitom. 2012 (Epub ahead of print).
11. Resch H., Trubrich A., Muschitz C., Kocijan R., Bittighofer C., Pirker T., Hans D. The impact of TBS in the analysis of gender specific differences in bone microarchitecture in females and males with fragility fractures // ASBMR annual meeting 2012 (S434).
12. Roux J.P., Wegrzyn J., Boutroy S., Bouxsein M.L., Hans D., Chapurlat R. The predictive value of trabecular bone score (TBS) on whole lumbar vertebrae mechanics: an ex vivo study // Osteoporos Int. 2013 (Epub ahead of print).
13. Winzenrieth R., Dufour R., Pothuaud L., Hans D. A retrospective case-control study assessing the role of trabecular bone score in postmenopausal Caucasian women with osteopenia: analyzing the odds of vertebral fracture // Calcif. Tissue Int. 2010; 86: 104-109.
14. Winzenrieth R., Cormier C., Del Rio L., Di Gregorio S. Is bone micro-architecture status at spine assessed by TBS related to femoral neck fracture? A Spanish case-control study // Osteoporos Int. 2013; 24: 991-998.
15. Lamy O., Metzger M., Krieg M.A., Aubry-Rozier B., Stoll D., Hans D. OsteoLaus: prediction of osteoporotic fractures by clinical risk factors and DXA, IVA and TBS // Rev. Med. Suisse. 2011; 7: 2130-2136.
16. Krueger D., Fidler E., Libber J., Aubry-Rosier B., Hans D., Binkley N. Spine trabecular bone score (TBS) subsequent to BMD improves vertebral and OP fracture discrimination in women // J. Clin. Densitom. 2012 (accep–ted).
17. Leib E., Lamy O., Winzenrieth R., Hans D. Assessment of women microarchitecture with and without osteoporotic fracture by TBS on white non Hispanic US women // 19th Annual ISCD meeting, Tampa, USA, 2013.
18. Hans D., Goertzen A., Krieg M.A., Leslie W. Bone microarchitecture assessed by TBS predicts osteoporotic fractures independent of bone density: the Manitoba study // J. Bone. Miner. Res. 2011; 26: 2762-2769.
19. Boutroy S., Hans D., Sornay-Rendu E., Vilayphiou N. et al. Trabecular bone score improves fracture risk prediction in non-osteoporotic women: the OFELY study // Osteoporos Int. 2013; 24: 77-85.
20. Popp A.W., Meer S., Krieg M.A., Perrelet R., Hans D., Lippuner K. Bone mineral density (BMD) combined with microarchitecture parameters (TBS) significantly improves the identification of women at high risk of fracture: the SEMOF cohort study // ECCEO-IOF joint meeting, Bordeaux, France, 2012.
21. Fan B., Lu Y., Genant H., Fuerst T., Shepherd J. Does standardized BMD still remove differences between Holo–gic and GE-Lunar state-of-the-art DXA systems? // Osteoporos Int. 2010; 21: 1227-1236.
22. Pencina M.J., D’Agostino R.B. Sr, D’Agostino R.B. Jr, Vasan R.S. Evaluating the added predictive ability of a new marker: from area under the ROC curve to reclassification and beyond // Stat. Med. 2008; 27: 157-172.
23. Youden W.J. An index for rating diagnostic tests // Cancer. 1950; 3: 32-35.
24. Breban S., Briot K., Kolta S., Paternotte S., Ghazi M., Fechtenbaum J., Roux C. Identification of rheumatoid arthritis patients with vertebral fractures using bone mineral density and trabecular bone score // J. Clin. Densitom. 2012; 201215: 260-266.
25. Romagnoli E., Cipriani C., Nofroni I., Castro C., Angelozzi M., Scarpiello A., Pepe J., Diacinti D., Piemonte S., Carnevale V., Minisola S. «Trabecular Bone Score» (TBS): an indirect measure of bone micro-architecture in postmenopausal patients with primary hyperparathyroidism // Bone. 2013; 53: 154-159.
26. Eller-Vainicher C., Morelli V., Ulivieri F.M., Palmieri S., Zhu–kouskaya V.V., Cairoli E., Pino R., Naccarato A., Scillitani A., Beck-Peccoz P., Chiodini I. Bone quality, as measured by trabecular bone score in patients with adrenal incidentalomas with and without subclinical hypercortisolism // J. Bone Miner. Res. 2012; 27: 2223-2230.
27. Paggiosi M., Eastell R. The impact of glucocorticoid therapy on trabecular bone score in older women // ASBMR annual meeting, Minneapolis, USA, 2012.
Переклад Роксолани Поворознюк та Павла Орлика